
The Health Check/Monitoring , Troubleshooting, Metrics and Analysis of the EC2 instances and getting timely alerts to fix the problems to keep your cloud architecture highly available, auto-scaling and fault tolerant are one of the important roles and responsibilities of a cloud architect or SysOps admin. Let’s check how we can achieve this. So lets first try to understand what CloudWatch is – Its is a AWS’s health monitoring service to monitor the AWS resources and the applications. It can monitor the following:
– Compute resources like Auto scaling groups, Load balancers, Route 53,
– Storage resources like EBS volumes, storage gateways, Cloud Front,
– Database services like relational RDS instances, non-relational services like DynamoDB,
– Analytics services like Elastic Map Reduce, Red Shift,
– In-memory cache services like Elastic Cache to name a few. The CloudWatch can monitor the following metric:
– CPU Utilization
– Disk Reads
– Network In and Outs
– Status checks
But it can’t check a few other metrics like Memory Utilization for that we have to add custom metrics, which we will see later in this post. The default monitoring checks these metrics every 5 minutes whereas the detailed monitoring is every 1 minute. The status checks listed above can be of two type:
– System Status Checks – checks related to the host on which the instance is virtualized. E.g Loss of network or power, software or hardware issues on the host machine. Normally restarting/terminating the instance or contacting AWS are the options available.
– Instance Status Checks – checks related to the VM(Virtual machine) itself. E.g. memory leaks, corrupted file system, incompatible file system, mis-configured network. Normally restarting/terminating the instance or checking/trouble shooting your own application for bugs are the options. On the AWS console go to the CloudWatch service :
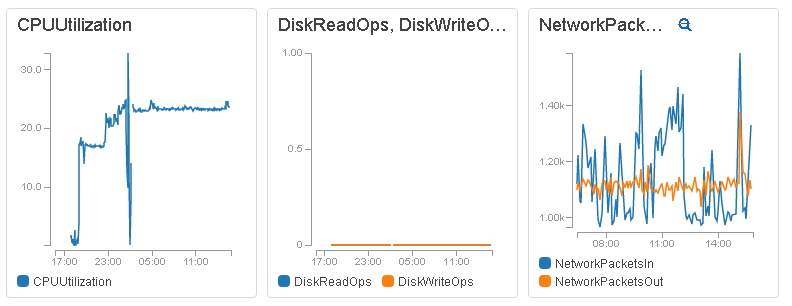
– Click “Create dashboard”
– Add a widget to dashboard based on the metrics listed above
– Save the dashboard.(See snapshot below)
 Now what if we want to monitor a custom metrics(Memory Utilization) which is not monitored by default by CloudWatch. Well then we have to use some custom scripts for it. Lets see how it is done.
- Install the required packages: sudo yum install perl-Switch perl-DateTime perl-Sys-Syslog perl-LWP-Protocol-https
- Download the CloudWatch Custom Monitoring Scripts: curl http://aws-cloudwatch.s3.amazonaws.com/downloads/CloudWatchMonitoringScripts-1.2.1.zip -O
- Unzip the scripts: unzip CloudWatchMonitoringScripts-1.2.1.zip
 rm CloudWatchMonitoringScripts-1.2.1.zip
 cd aws-scripts-mon
- Execute the script(You will get a "Successfully reported metrics to CloudWatch. Reference Id: 84bf63d3-2841-11e7-a20f-7786b8297dbd
" message on success): ./mon-put-instance-data.pl --mem-util --mem-used --mem-avail
- Add a crontab job for 5 minutes intervals: */5 * * * * ~/aws-scripts-mon/mon-put-instance-data.pl --mem-util --disk-space-util --disk-path=/ --from-cron
Once you have run these scripts successfully, the custom metrics for memory utilization will also be available and you can add it as a widget. See below. 